Best Graph Plotting and Graphing Software
Graphs and plots are the most convenient and beneficial way to show your data. The list below mentions the best graph plotting and graphing software.
Whether you are a researcher, scientist, statistician, engineer, financial officer, or salesperson, graphs, and plots are some of the most important things. They convey hundreds of words and deduce lots of information.
Modern graph plotting software and tools provide advanced features and stylish design to your graph, attracting the attention of your audience. The names, here, give you the best graphing software that will make your life easier.
MATLAB
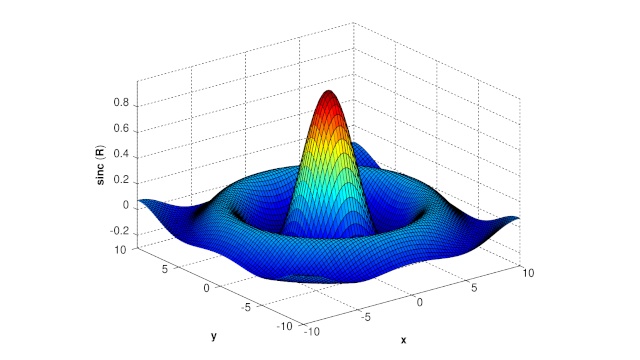
MATLAB is a numerical computing high-level programming language developed by MathWorks and provides an interactive environment for numerical analysis, data visualization, and programming. With more than 3 million registered users worldwide, it is used by engineers, economists, and scientists. The capabilities offered by MATLAB are matrix manipulation, 2D- and 3D-graph plotting, curve fitting, linear algebra, non-linear equations, data analysis, statistics, calculus and integration, and differential equations.
MATLAB has integrated graphing features. The software supports both two-dimensional and three-dimensional graphics and generally used by researchers to visualize scientific data. You can use MATLAB GUI plotting tools to create interactive graphs or use the command-line interface to generate graphs.
| Developer | MathWorks |
|---|---|
| Founded By | Cleve Moler |
| Written In | C/C++ |
| Operating System | Windows 10, macOS, and Linux |
| License | Proprietary |
| Website | mathworks.com |
Tableau Software
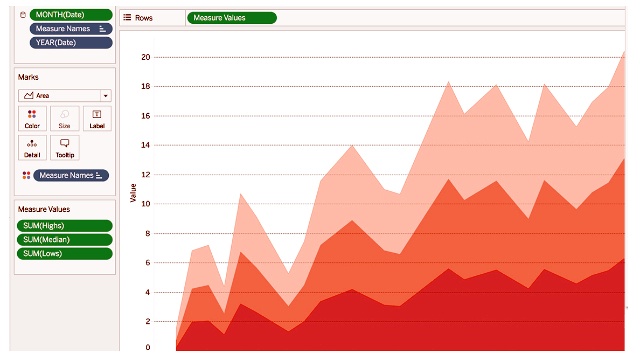
Tableau Software is an American data visualization company founded in 2003. The company offers its customers analytic and data visualization tools to create beautiful visuals that can be shared on blogs and websites. Its products are Tableau Desktop, Server, Prep, Data Management, Server Management, and Embedded Analytics and available for both individuals and organizations. Data analysis and visualization are simplistic to work with Tableau. Users do not require any technical skills like programming to use it. Its features are data blending, real-time analysis, and data collaboration. Many industries, including communications & media, healthcare & life science, retail & consumer goods, energy, manufacturing, finance, are regular customers of the company.
| Founded By | 2003 |
|---|---|
| Founded By | Christian Chabot, Chris Stolte, Andrew Beers, and Pat Hanrahan |
| Headquarters | Seattle, Washington, United States |
| Key People | Adam Selipsky (CEO) |
| Products | Tableau Desktop, Tableau Prep, Tableau Server, and Tableau Online |
| No. of Employees | 4,181 |
| Parent | Salesforce |
| Website | tableau.com |
Wolfram Mathematica
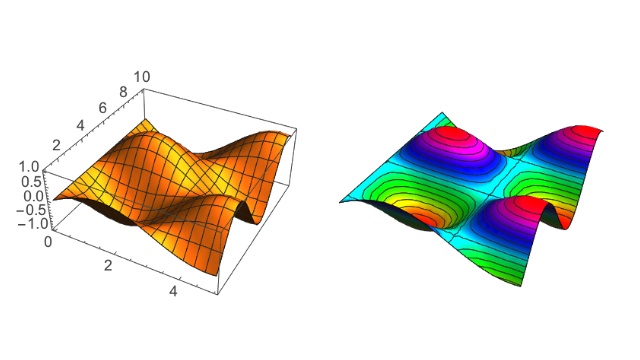
Wolfram Mathematica is modern high-level computing software, covering many areas of science like numerical computing, neural networks, geometry, data science, image processing, machine learning, and data visualizations. Mathematica is used by computer scientists, engineers, mathematicians, physicists, and biological scientists. With high computing potential, it is powerful software and can handle complex mathematics like differential equations. The Wolfram Language is used in Mathematica.
Users can plot interactive graphs in many ways with in-built functions. The graphs are customizable and can fit the needs of users. From simple to complex, 2D to 3D, Mathematica can analyze, model, and visualize all kinds of graphs.
| Developer | Wolfram Research |
|---|---|
| Founded By | Stephen Wolfram |
| Written In | C/C++ and Java |
| Operating System | Windows 10, macOS, Linux, Raspbian, and Online |
| License | Proprietary |
| Website | wolfram.com/mathematica |
GeoGebra
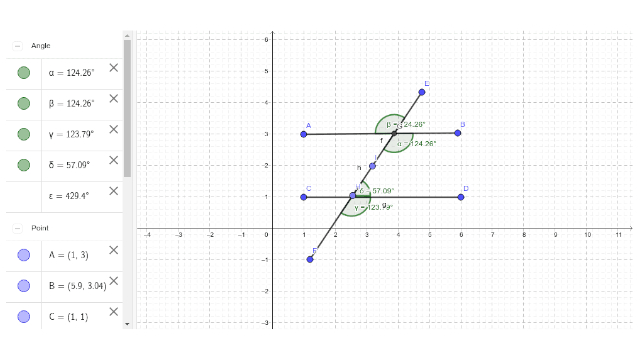
GeoGebra is a free online graphing tool. It is developed in HTML and Java and intended for educational purposes from primary school to university level. It can also be installed on your Windows 10, macOS, and Linux computer and your Android and iPad. Features available in GeoGebra are numerical calculations, function operations, fraction operations, graphing tools, vectors and matrices, geometric constructions, 3D graphing, equation solving, etc. GeoGebra is best used for learning and teaching and provides an easy-to-use interface that includes graphing, geometry, algebra, spreadsheets, statistics, and calculus.
GeoGebra offers free online interactive graphing calculators for 2D and 3D. Users have to enter the equation, and the graph gets plotted.
| Developer | Markus Hohenwarter et al |
|---|---|
| Founded By/th> | Markus Hohenwarter |
| Written In | Java and HTML5 |
| Operating System | Windows 10, macOS, Linux, ChromeOS, and Web App |
| License | Non Commercial-Freeware |
| Website | geogebra.org |
Highcharts
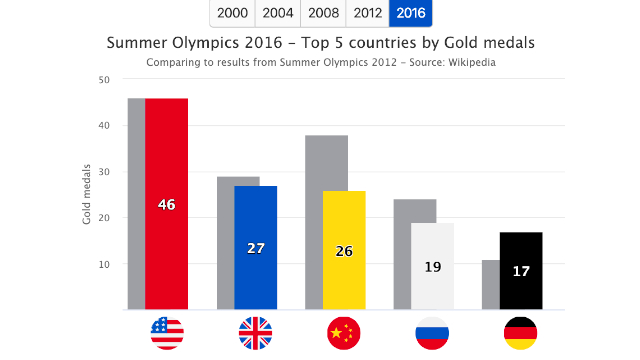
Highcharts is a Norway-based charting software library built on vanilla JavaScript. The library was founded by Torstein Hønsi in 2009 and is free to use for non-commercial purposes. With Highcharts' interactive API, users can view various interactive charts in their web pages and blogs. It supports line, area, bar, pie, bubble, column, funnel, spline, scatter, and waterfall charts. The world's notable companies like Facebook, Twitter, Yahoo, Visa, Nokia, Verizon, at&t, Yandex, Petrobras are their clients.
| Founded/th> | 2009 |
|---|---|
| Founded By | Torstein Hønsi |
| Written In | JavaScript |
| Headquarters | Vik i Sogn, Norway |
| Key People | Grethe Hjetland (CEO) |
| Products | Highcharts, Highcharts Stock, Highcharts, Maps, Highcharts Cloud, and Highcharts Gantt |
| No. of Employees | 30+ |
| Website | highcharts.com |
Anaconda
Anaconda is a free and open-source distribution of Python and R. It is packed with more than 400 python libraries and used for machine learning, data visualization, image processing, scalable computing, natural language processing. Anaconda is also available in the enterprise edition. Popular Python and R applications like JupyterLab, Jupyter Notebook, Spyder, QtConsole, Glue, Orange, RStudio come preinstalled with the software.
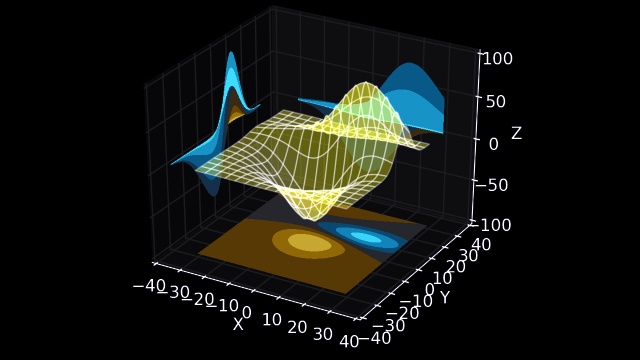
Anaconda has many in-built tools and python & R libraries like Glue, Orange, Matplotlib, Bokeh, ggplot2 that can create 2D and 3D graphs. Matplotlib is a popular graph plotting python library, which gives a MATLAB-like experience.
| Developer | Anaconda, Inc. |
|---|---|
| Founded By | Peter Wang and Travis Oliphant |
| Written In | Python |
| Operating System | Windows 10, macOS, and Linux |
| License | New BSD License |
| Website | anaconda.com |
Visme
Visme is an online tool that enables users to create infographics, presentations, charts, graphs, documents, printables, social media graphics, banner ads, and other visuals. It provides various tools and assets like templates, graphics to make stunning visuals. Visme is used by IBM, MetLife, Sony, NASA, Hollard, and many other companies.
You can create 40+ charts and diagrams and don't require any programming skills. First, you need to upload your data from MS Excel, Google Sheet, or CSV files. And then, you can select the type of chart desired. Popular charts are bar, flow, pie, line diagram, and histogram. Finally, you can download them for offline use, share them on social media, or private them—Use them the way you want.
| Founded | 2013 |
|---|---|
| Founded By | Payman Taei |
| Headquarters | Maryland, United States |
| No. of Employees | 40+ |
| Website | visme.co |
Graphpad Software
Graphpad Software is a California-based company founded in 1989 by Dr. Harvey Motulsky, who was a then-faculty of the Department of Pharmacology at the University of California, San Diego. The company provides scientific graphing and graph plotting software. Prism is the most popular and primary software of the company; others are Instat and StatMate.
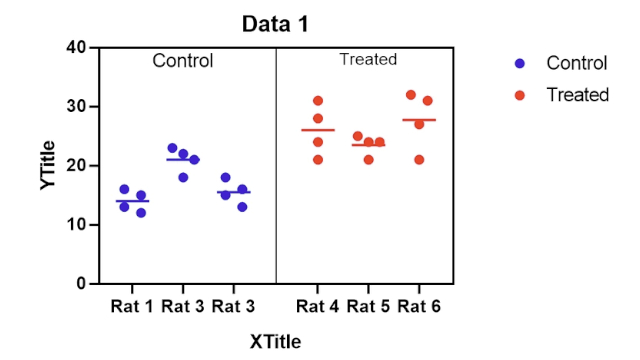
GraphPad Prism is 2D graphing, analysis, and statistics software. With features like one-click regression analysis, programming-free interface, graph customizations, and enhanced collaboration, it is solid statistics software. Other technical features are statistical comparisons, column statistics, simple linear regression & correlation, generalized linear models, nonlinear regression, simulations, and clinical lab statistics.
| Developer | GraphPad Software, Inc. |
|---|---|
| Founded | 1989 |
| Founded By | Harvey Motulsky |
| Products | Prism, Instat, and StatMate |
| Headquarters | San Diego, California, United States |
| Operating System | Windows 10 and macOS |
| License | Proprietary |
| Website | graphpad.com |
Chart.js
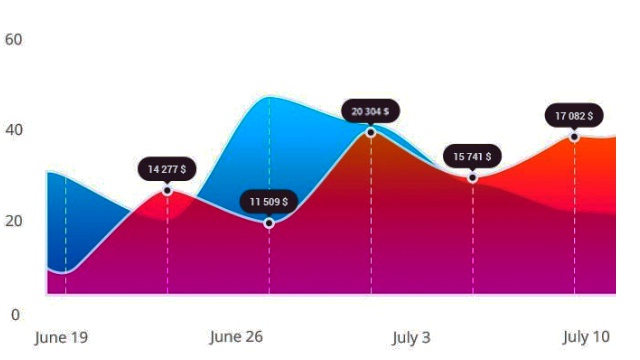
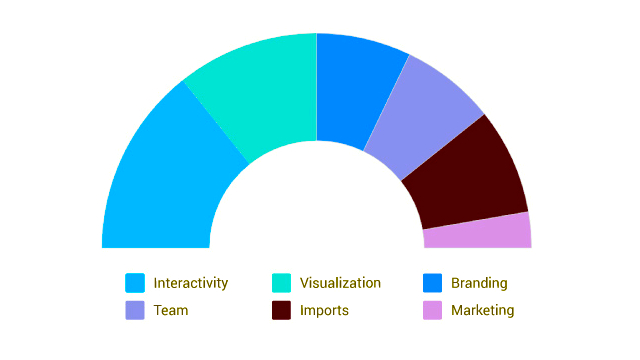
Chart.js is an open-source Javascript library developed by an English web developer. It is the second most data visualization popular library on Github, after 3D.js. Although with limited features, it is named as one of the best charting libraries because of its simplicity. Chart.js renders in HTML canvas and offers 8 responsive charts: line, area, bar, pie (doughnut), radar, bubble, polar, and scatter. You can also create mix charts and further animate them.
| Founded | 2013 |
|---|---|
| Founded By | Nick Downie |
| Written In | JavaScript |
| License | MIT |
| Website | chartjs.org |
Infogram
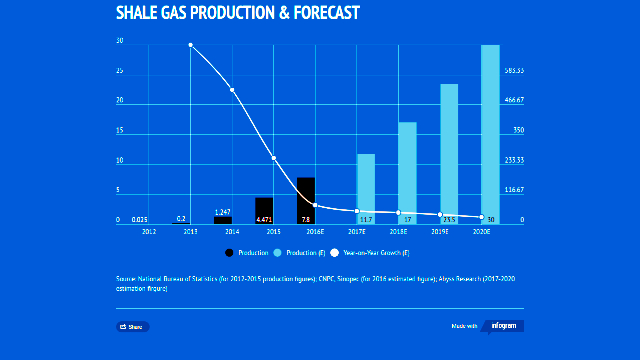
Infogram is a visualization and infographic company founded in 2012. It is one of the best infographic tools available online. Forbes ranked it No. 1 in 2017 for the best infographic tools. To its more than 43 million users, Infogram offers infographics, reports, slides, maps, and social media graphics. With an intuitive interface, users can easily create visuals and infographics that can be embedded, shared, and published. Infogram's customers include media, corporates, governments, and individuals.
A variety of charts and graphs are available on their website, such as bar, column, line, area, scatter, bubble, pictorial, funnel, pyramid, candlestick, treemap, and word cloud.
| Founded | 2012 |
|---|---|
| Founded By | Uldis Leiterts, Raimonds Kaže, and Alise Dīrika |
| Headquarters | Riga, Latvia |
| Parent | Prezi, Inc. |
| Website | infogram.com |
Origin
Origin is a proprietary graphing and data analysis software developed by OriginLab. With 500,000 registered users, it is widely used by scientists and engineers across industries, academia, universities, and governments. Origin Pro capabilities are graphing, peak analysis, data exploration, curve and surface fitting, statistics, signal processing, mathematical computing, data processing, batch processing, and many others. Unfortunately, the software is only available for Windows 10, not for macOS.
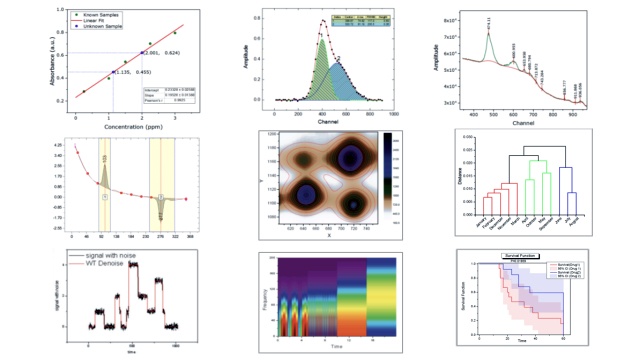
Origin provides plenty of 2D and 3D graphs and charts, which are all customizable. Some of them are column charts, bar charts, bridge plots, 2D pie and doughnuts, line graphs, density plots, kite diagram, polar plots, radial plots, waterfall plots, contours, heatmaps, box charts, histograms, scatter charts, image plots, 3D surface plots, 3D pie diagrams, 3D ternary diagrams, 3D columns, piper diagrams.
| Developer | OriginLab Corporation |
|---|---|
| Founded | 1992 |
| Headquarters | Northampton, Massachusetts, United States |
| Operating System | Windows 10 |
| License | Proprietary |
| License | originlab.com |
D3.js (Data-Driven Documents)
D3.js is one of the best data visualization libraries written in JavaScript. D3.js allows users to create stunning, interactive visuals on modern web browsers using SVG, HTML, and CSS. With numerous features and customizations, it is an extensive and sizable library that can handle large data. Important features of D3.js are data-driven, DOM manipulations, dynamic properties, complying with web standards, interactive, custom visuals, and animation. You can create any type of chart or graph with the library. However, it is not user-friendly. One needs to have the technical knowledge to get what one wants.
| Developers | Mike Bostock, Jason Davies, Jeffrey Heer, and Vadim Ogievetskyn |
|---|---|
| Founded | 2011 |
| Written In | JavaScript |
| License | BSD |
| Website | d3js.org |