How to Read a Ternary Diagram?
Ternary diagrams or ternary plots are very common in chemical engineering, physical chemistry, metallurgy, genetics (de Finetti diagram), and other physical sciences. They are mainly used to study compositional data for a mixture of three different substances.
Below is an example of a typical ternary diagram.
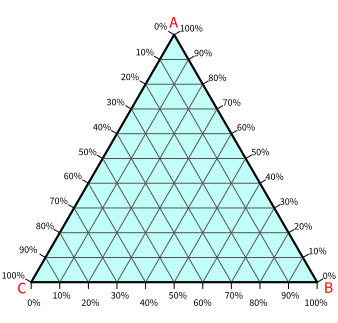
As we can see, each of the three corners of a triangle is labeled by alphabets: A, B, and C. These alphabets represent three different substances.
A ternary diagram is always a triangle with each of its three corners representing a pure substance. Here, we have taken an equilateral triangle, which is very common, to represent compositional data. However, you can do that with a non-equilateral triangle too. In the following text, we will continue with equilateral triangles only since they are most commonly used and easy to understand.
Reading a ternary phase diagram
Now, you have understood some basics of a ternary diagram. Let's move forward to details.
As a ternary diagram represents three different substances, it is a three-dimensional plot drawn on a two-dimensional plane.
Three vertices of the triangle represent three pure substances. In the above diagram, point A represents 100% of substance A. In the same way, point B and point C represent 100% of B and 100% of C, respectively.
We have three different scales to measure each of the three compositions. The three different scales are nothing but sides of the triangle.
Note: Although there are three scales, we only need two compositions to represent a point on the diagram. That's because the sum of the compositions of A, B, and C at any point on the triangle is always constant. You will understand this better as you read the subsequent text.
In subsequent sections, we will break the ternary plot into three separate skeletons according to the compositions.
Skeleton of A
The figure below consists only of substance A. We have removed the scales of B and C.
At point A, the composition (or abundance) of A is maximum, equal to 100%. As we move downward, the percentage of A decreases and becomes zero on the line BC. The percentages in-between the two extremes are marked on the scale, the right to the plot.
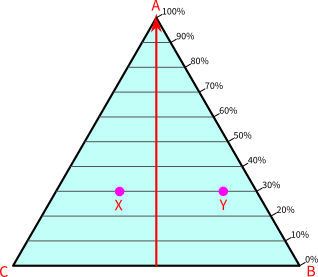
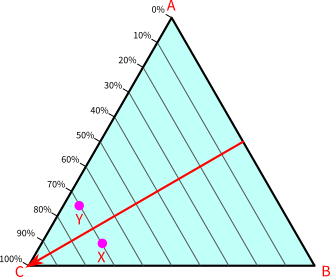
If you have noticed, the percentages of A are proportional to the altitude of the triangle. In simple words, it means the percentage of A remains constant on the horizontal line. For example, the percentage of A at points X and Y are the same, equal to 30%. The percentage of A is constant and equal to zero at all points on line BC, including point B and point C.
Skeleton of B
The below ternary diagram depicts the composition of substance B. Point B is the bottom right vertex of the triangle. Its percentages are 100% at point B and zero at all the points on line AC.
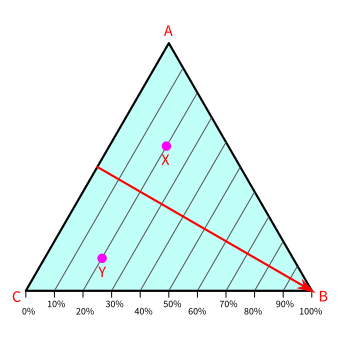
The compositions of B decrease as we move farther from point B and increase as we get closer to point B.
All the points on a line that runs parallel to line AC have the same composition of B. For example, the percentage of points X and Y equals 20%. The percentage of all points on line AC, including points A and C, equals zero.
Skeleton of C
In the skeleton of C, the scales of A and B are erased. Point C is the bottom left vertex of the triangle. At point C, the composition of C is 100%, and at all the points on line AB, the composition of C remains zero.
For any points between point C and line AB, the composition of C is non-zero. Points that are closer to point C have higher percentages than points that are away from point C.
Points on lines that are parallel to line AB have the same percentage of C. For example, point X and point Y have the same composition of C equal to 70%.
Sample Points
Using the above explanation we can determine the compositions of A, B, and C at any point on the diagram. In the below diagram, there are some arbitrary sample points (X1, X2. X3, X4, X5, and X6). Try to find the compositions of these sample points.
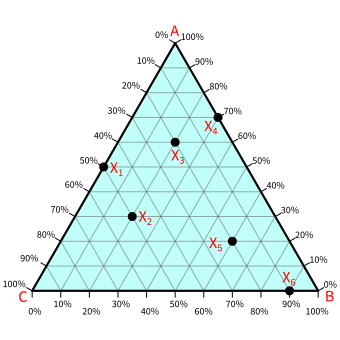
Take the example of X2. For the composition of A at X2, find the line parallel to BC and passing through X2. From that line, we can see the percentage of A equals 30%. In the same way, for the composition of B at X2, find the line parallel to AC and passing through X2. From that line, the percentage of B is determined, and it equals 20%. Finally, for C, we find the line parallel to AB, which gives 50%.
The compositions for the rest points are shown in the below table.
| Point | A | B | C |
|---|---|---|---|
| X1 | 50% | 0% | 50% |
| X2 | 30% | 20% | 50% |
| X3 | 60% | 20% | 20% |
| X4 | 70% | 30% | 0% |
| X5 | 20% | 60% | 20% |
| X6 | 0% | 90% | 10% |
If you have noticed, the sum of compositions at any point always equals 100%. That is the sum of A%+B%+C% = 100%. So, by knowing the compositions of any two substances, we can determine the composition of the third.
Example of ternary diagram
We often examine liquid-liquid extraction using a ternary phase diagram. The following phase diagram is of acetic acid, water, and chloroform.
Each of the vertices of the triangle is a 100% pure substance. In the below diagram, the top vertex is 100% acetic acid, the bottom left is 100% water, and the remaining one is 100% chloroform.
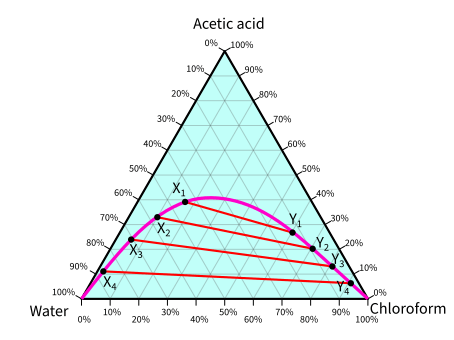
(X1, Y1), (X2, Y2), (X3, Y3), and (X4, Y4) are equilibrium points. And if you want to determine the composition of acetic acid, water, and chloroform, it would not be easy since these points are off the grid lines. You may try to guess the compositions for off-grid points, but it would definitely result in significant errors in the values.
In such a situation, we will need help from data extraction software, like PlotDigitizer.com.
How to use PlotDigitizer to read and extract data from a ternary diagram?
Using PlotDigitizer, you can read and extract data from any ternary diagram. It may not be an equilateral triangle. PlotDigitizer can read and extract data from an equilateral triangle, a right angle triangle, or any scalene triangle.
You only have to upload the ternary plot in an image format, like JPG, PNG, GIF, and then the following simple steps:
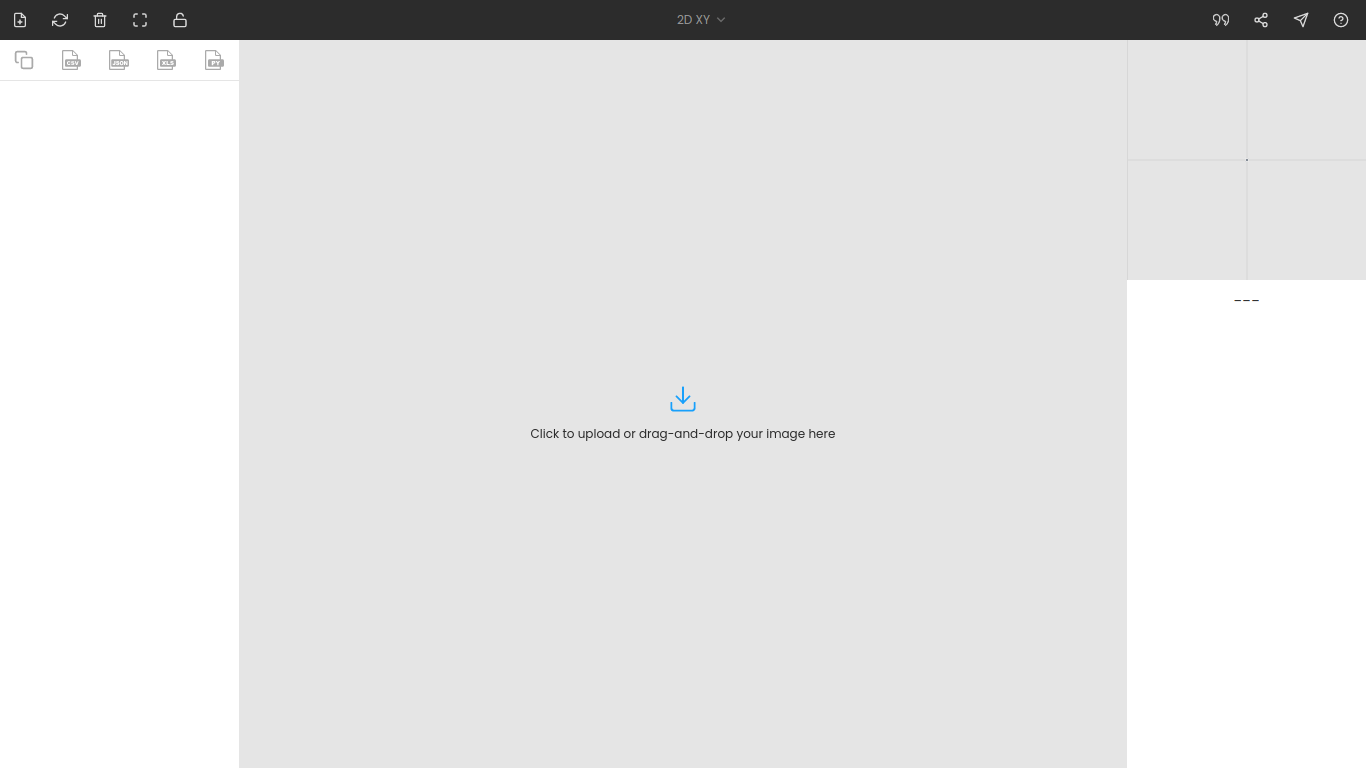
First, it will ask you to upload an image.
After uploading your desired ternary diagram, you have to switch the graph type to ternary.
Once you select the ternary option, three points (A, B, and C) will be displayed on your screen. These points are vertices of the triangle. So, now you have to drag and drop each point to each vertex of the triangle on the image. You can use the zoom panel to improve accuracy.
There is no order; you can fix any point at any of the vertices of the triangle. In the below screenshot, point A is fixed to acetic acid.
After fixing all the points (A, B, and C), you can find the percentages of acetic acid, water, and chloroform at any point on the diagram. The percentages of the three components are displayed below the zoom panel as you hover the cursor. To record the percentages, press the mouse button. You can see the recorded values on the dataset panel, and moreover, you can also export the values to given formats, like CSV, Excel, programming array.
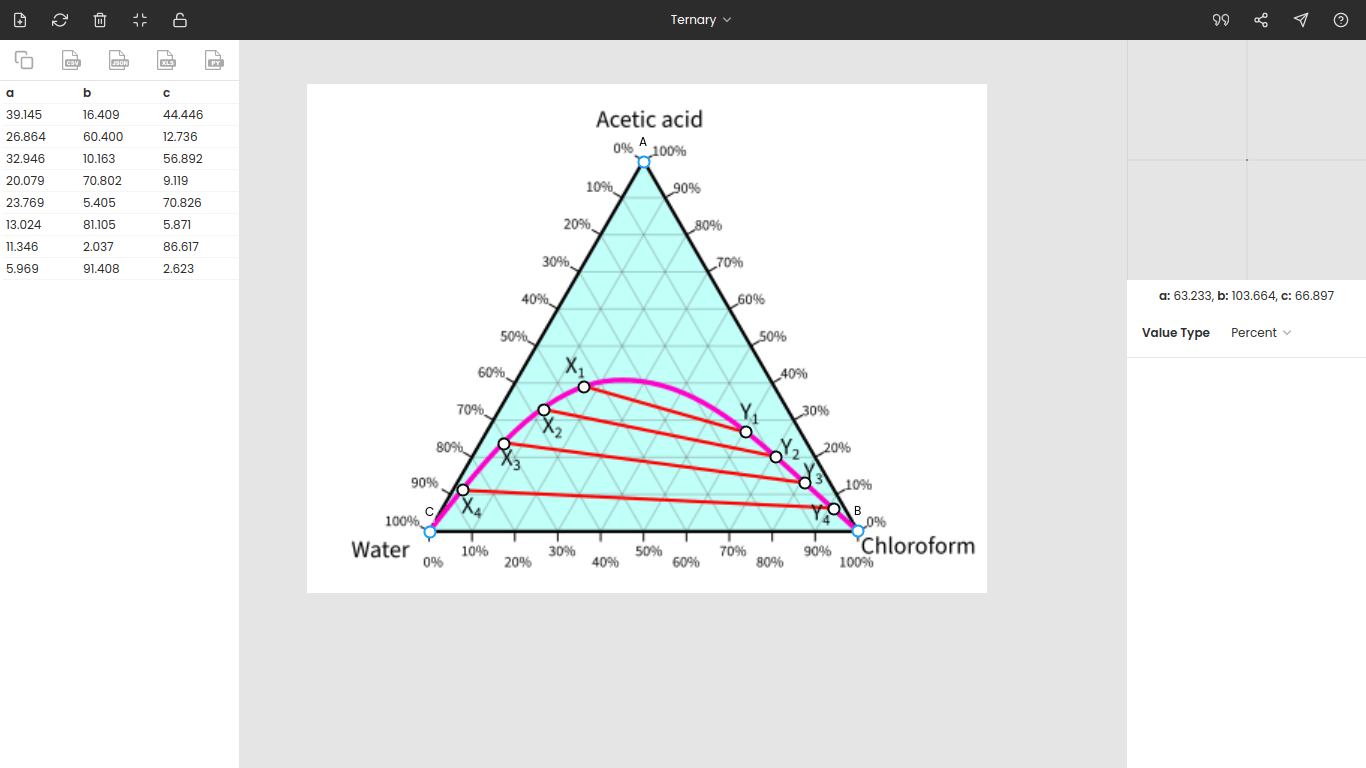
The table below presents the equilibrium data extracted using PlotDigitizer from the ternary phase diagram.
| Point | Acetic acid | Chloroform | Water |
|---|---|---|---|
| X1 | 39.145 | 16.409 | 44.446 |
| Y1 | 26.864 | 60.400 | 12.736 |
| X2 | 32.946 | 10.163 | 56.892 |
| Y2 | 20.079 | 70.802 | 9.119 |
| X3 | 23.769 | 5.405 | 70.826 |
| Y3 | 13.024 | 81.105 | 5.871 |
| X4 | 11.346 | 2.037 | 86.617 |
| Y4 | 5.969 | 91.408 | 2.623 |