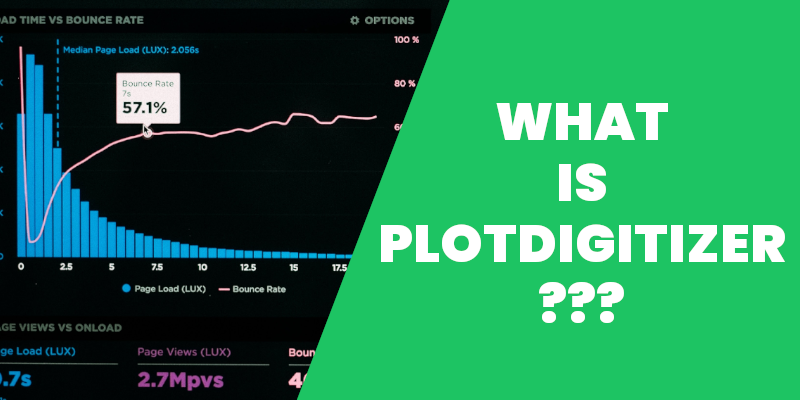
What is Plot Digitizer?
In this world of the internet, digitization has become central to everything, including data representation. Whether you are a scientist, engineer, marketer, journalist, or financier, we all have loads of data to share with our audience. And we share these data in the form of visuals, like graphs, charts, fancy diagrams.
However, there are cases when you have to undo these graphs and charts instead of visualizing data. This reverse-engineering process is really tricky and very not simple.
There are many challenges to it, and further, it is extremely time-consuming. Without the right tool, you might end up wasting your valuable time in extracting data from your graphs.
Although there are many tools on the internet that can reverse-engineer your graphs, not all of them are effective and efficient in doing the job. PlotDigitizer.com is one of the best software available on the internet that comes with plenty of features.
What is PlotDigitizer?
PlotDigitzier, as the name says, converts your graphs and charts into numerical data. It reads and extracts the underlying numerical data from images. For physical documents, you can scan and upload them into PlotDigitizer. Its automatic detection feature really makes data extraction easy and quick.
Here are some of its features:
- You upload all common image formats, including PNG, JPG, JPEG, SVG, GIF, BMP, TIFF.
- PlotDigitizer supports several types of graphs: XY, polar, pie, ternary, bar, column, maps, distance calculation, etc.
- The software works with both linear and nonlinear scales (logarithmic, dates, angular, time).
- The extracted data can be exported to other file formats. For example, you export the data into MS Excel format.
- You can create multiple datasets.
- Auto tracing toolset comes in handy.
Examples
Let us take an example:
The graph below is the market summary of Dow Jones on Dec 18, 2020.
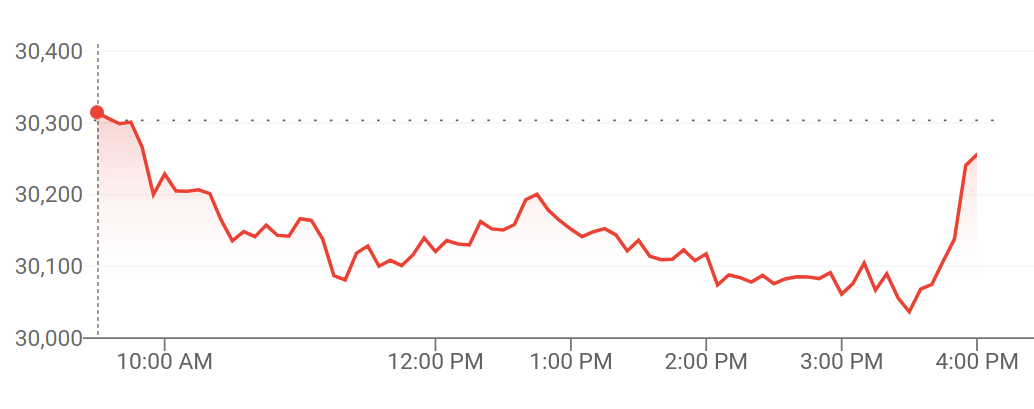
The graph is an XY plot. The y-axis is a linear scale, having an increment of 100 points. On the other side, the x-axis is a nonlinear scale, having an increment of 1 hour.
Now, let's say you want to know the stock price at 11:33 AM. It will not be easy if you do it manually. However, with the help of PlotDigitizer, you can find the stock price at whatever time you desire.
You only have to upload the image and follow a few basic steps, like selecting the graph type, scaling the graph scale.
Consider one more example. This one's from the scientific field. Ternary diagrams are pretty common in process and chemical engineering. The diagram below is an equilibrium diagram of three different components: A, B, and C.
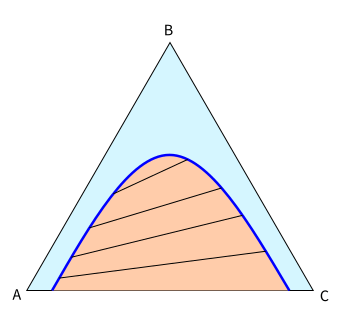
If you take a careful look at the diagram, there is no scale at all on the figure. It will not be so easy to extract data from the equilibrium curve. But using Plotdigitizer, the data extraction process becomes far more simple. The only thing you have to do is upload the image and adjust the position of A, B, and C. That’s it.