How to Extract Data from Graphs or Images in Scientific Papers?
Scientific results or analyses are often visualized in journals in the form of graphs. As researchers, we are interested in studying these published visuals and want to further analyze and improve the results. However, the associated raw data with the published graphs are not always available in the papers. Sometimes, we might want to correlate our revised results with historical plots, and there is no numerical data published along with reports.
It brings us to the point where we need to somehow reverse-engineer graphs and extract the data from them in the numerical format. This process of reverse engineering is the digitization of data. In other words, we are retrieving the information embedded inside the graphics.
Extracting Data from Graphs or Images using PlotDigitizer
Extracting data from published graphs or images is not a simple process and could consume a significant amount of time without the right tools. PlotDigitizer is one such professional tool that is capable of extracting data from graphs.
PlotDigitizer is freemium software; the online version is free with limited functionality, while the offline version is paid. It is available for all operating systems.
How to use PlotDigitizer to extract data from Graphs?
The first step in the digitization is to get the graph in the image file format. If the visual is in document formats, like PDF, you can capture the screenshot of the graph. Or, if the scientific visual is in the physical format, you can scan the document and then crop out all unnecessary portions of the image.
PlotDigitizer has an in-built image editing tool kit with which you can crop, flip, rotate, or scale the image as required. For example, if the image is slightly tilted, you can use the rotate tool to align the image appropriately.
Besides standard XY, PlotDigitizer supports several types of graphs, e.g., polar, ternary, bar, column, pie/doughnut, map. Moreover, you can also calculate the distance, angle, and area on the image.
Here are simple steps for extracting data from XY graphs:
Step 1: Find the graph in an image format
The first, foremost step is to get a graph in image file formats, such as PNG, JPG, JPEG, SVG, GIF, TIFF.
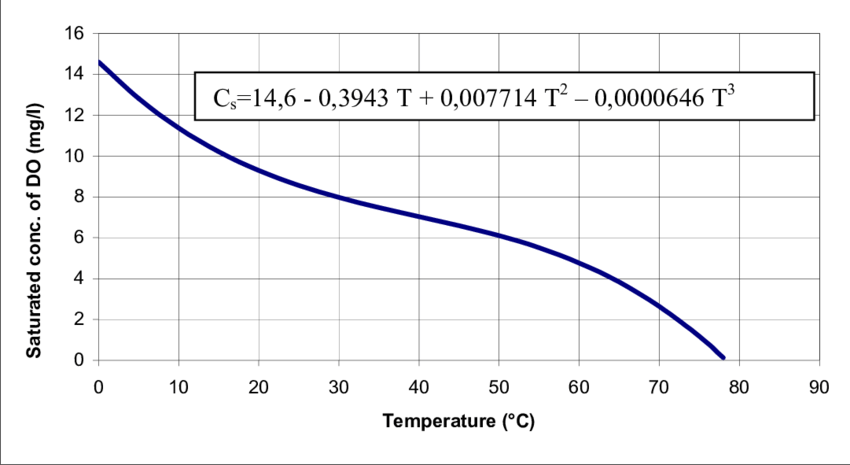
Here, we have taken the following graphs as a sample image.
The curve below represents the solubility of oxygen (expressed on the y-axis) in water with temperature (expressed on the x-axis). The image is taken from ResearchGate.
Step 2: Upload the image to PlotDigitizer
Upload or drag-drop the image in PlotDigitizer.
Step 3: Adjusting the image
We can adjust the image to make it fit properly. For example, crop out the unwanted parts or rotate the image to make it align with the screen, or scale it to increase/decrease the resolution. In our case, the image is perfect; there is no need for any modifications.
Step 4: Calibrating the axes
Once the image is uploaded, the four points will appear around the center of the view. These are nothing but the x and y coordinates of the individual axes. Drag these points to the extremes of the plot. Here x1 and x2 are dragged, placed at 0 and 90, while y1 and y2 are dragged, placed at 0 and 16. You can use the zoom panel to increase the accuracy while calibrating the axes.
Both axes are linear scales. Now, enter the values of the points x1, x2, y1, and y2, i.e., 0, 90, 0, and 16.
Note: We have placed the points to the extremes to improve the accuracy, but it is not necessary. Also, the points do not necessarily have to be set on the axes. You can drop on them in-between the plot.
Now, the entire graph is calibrated. You can see the coordinate for the mouse’s cursor below the zoom panel. If you want, you hide x1, x2, y1, and y2 by clicking on the lock icon on the top of the window.
Step 5: Extracting the data points from the plot
Finally, we can extract data points from the curve. Mark various points on the curve and their respective values are recorded on the side panel.
You can collect as many points as you want. Also, instead of manual extraction, you can use the automatic extraction feature to collect a large number of data points.
Step 6: Exporting the extracted data points
In the end, we can export the extracted points into other formats, like CSV, MS Excel, JSON, MatLab, Array.
Here, we have discussed the XY graph, but for every other type of graph, the process of digitization is very similar.