How to Read a Polar Graph?

Polar graphs are a two-dimensional coordinate system commonly used in navigation and studying a quantity by directions. Like the cartesian system, the polar coordinate has two variables (radius and theta) to uniquely define a point.
Understanding polar coordinates
The polar coordinate system consists of two parameters: radius and theta. Radius (r) is the distance between the origin and a point on a polar graph. It is a non-directional parameter; it means it does not have direction. Theta (θ), or better known as an angle, defines the angular position of a point from the reference line. Unlike radius, theta is directional.
In the cartesian coordinate system, we define the position of a point by x and y, which are perpendicular distances from both axes, while in the polar coordinates, a point is identified by r and θ.
Based on the direction of the measurement of the angle, we categorize polar graphs as anticlockwise and clockwise.
Anticlockwise
Anticlockwise, as the name says, the angle is measured anticlockwise, opposite to the way in which the hands of a clock move.
Whenever we measure an angle, we use a reference line from which the angle is measured. In the below figure, the reference line is the right x-axis. We start measuring the angle from this line, and the angle is 0° for all points on the right x-axis.
The angle is 90° for the top y-axis. In the same way, the angle is 180° and 270° for the left x-axis and bottom y-axis.
The center is the origin, with zero radii. At an angle of 360°, we reach the same reference line, completing the entire circle.
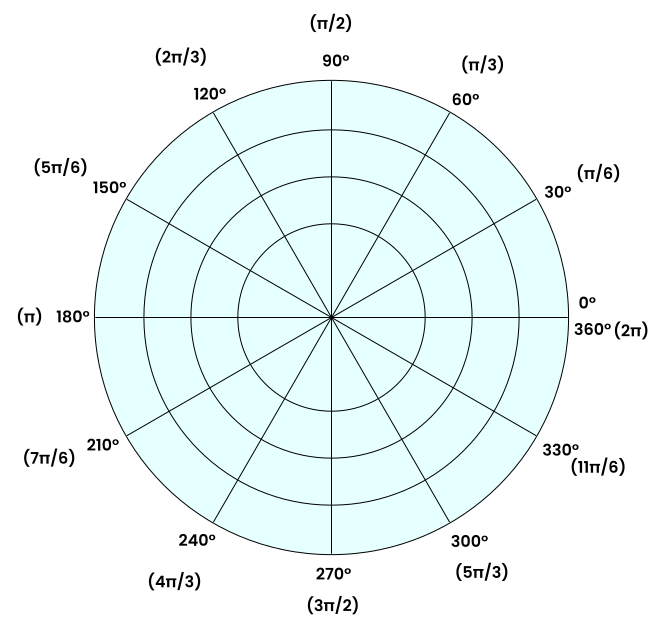
In the previous diagram, the angles are reported in both degrees and radians.
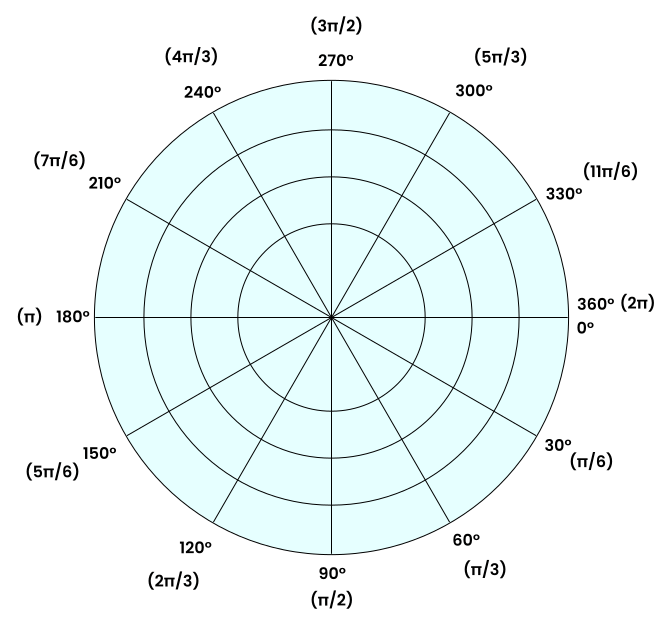
Clockwise
In the clockwise polar diagram, angles are measured in the direction of the hands of a clock, like in the following figure.
Directions
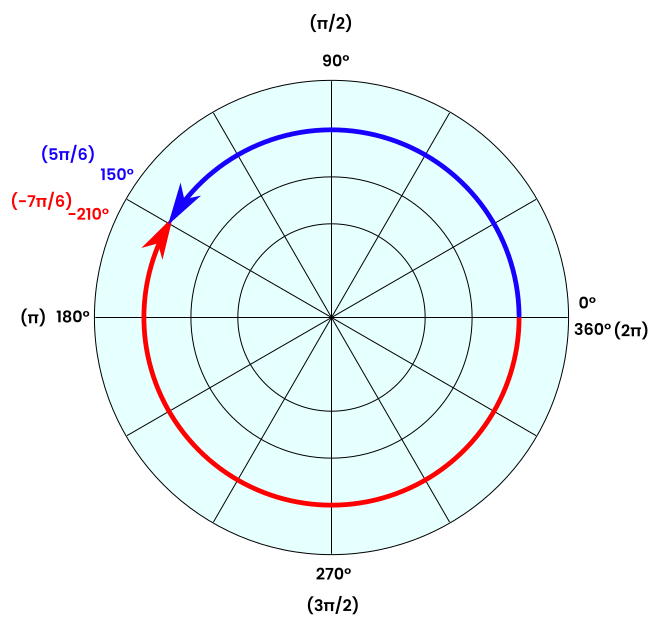
As mentioned earlier, the angle has direction. If an angle is negative, then the direction of the measurement of the angle is opposite to the direction of the graph.
In the below polar graph, 150° and −210° reach the same position. The angle −210° means the angle is measured in the opposite direction to the direction of the graph, which is anticlockwise.
Examples of polar graphs
Let us take some basic examples to better understand polar graphs.
Points
The following graph has some random points. We want to determine the coordinates (radius, angle) of each of these.
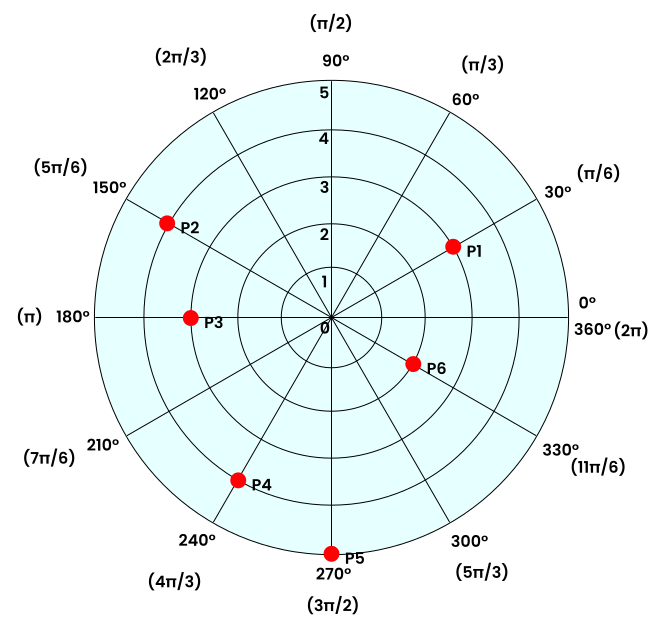
The point P1 is located at 30° and a radius of 3. So, the coordinates are 3, 30°.
In the same way, we can calculate the polar coordinates for the rest.
| Point | Radius | Angle |
|---|---|---|
| P1 | 3 | 30° (or π/6) |
| P2 | 4 | 150° (or 5π/6) |
| P3 | 3 | 180° (or π) |
| P4 | 4 | 240° (or 4π/3) |
| P5 | 5 | 270° (or 3π/6) |
| P6 | 2 | 330° (or 11π/6) |
Equations
In the following diagram, there is a line and a circle. We wish to determine the equations of these curves.
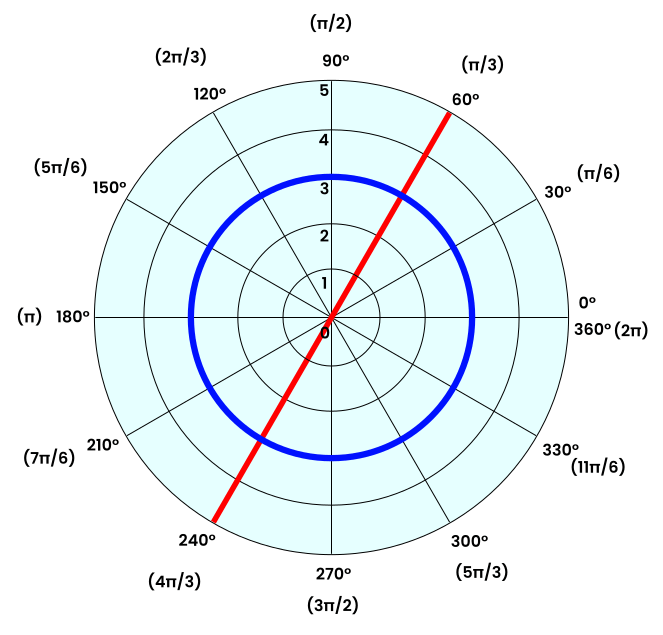
The line passes to the origin and is tilted at an angle of 60° (or π/3). So, the equation is θ = π/3. Since there is no radius term in the equation, it is independent of the radius.
The circle is at a radius of 3, with the origin as the center. So, the equation is r = 3, and it is independent of theta.
The same equation in the cartesian coordinate system would be y = tan(π/3) × x for the line and x2 + y2 = 32 for the circle.
These are far simpler equations; most equations will have both r and θ in them.
How to read and extract data from a polar graph using PlotDigitizer?
You can read and extract the data from a polar graph using PlotDigitizer. PlotDigitizer is data extraction software that can extract data from several types of graphs, including polar. It has a free online app. Other graphs are XY, ternary, pie/doughnut, bar, column.
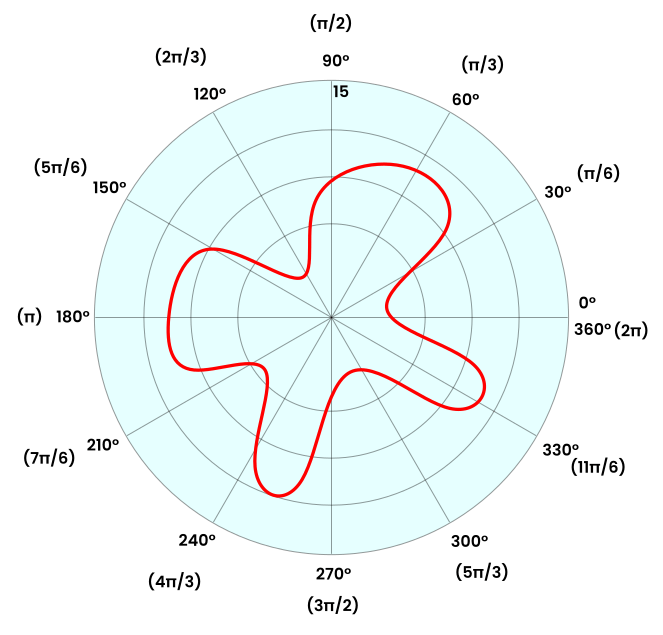
You need to follow a few simple steps. We will take the following graph as an example of our explanation.
Step 1: Uploading the polar graph image
Visit https://plotdigitizer.com/app, and upload or drag-drop the image.
Step 2: Selecting the graph type
By default, the graph type is XY, so we have to change it to polar. This can be achieved by a selection menu from the bar of the window.
Step 3: Calibrating the graph
Now, drag and drop the point O to the origin of the graph, place the point θ to any known angle. Here, we have placed θ at 30°. Move the point r to a known radius.
Enter the values of θ and r in the side panel. Here r = 15 and θ = 30°. The polar diagram is anticlockwise, so the direction is kept anticlockwise.
You can use the zoom panel (or magnifier) to improve the accuracy of markings.
Step 4: Extracting the data from the graph
After calibrating the graph, we can see the coordinates of the cursor below the zoom panel.
You can start tracing the red curve in the figure by clicking on the curve. And the respective polar coordinates are recorded on the left side panel.
Step 5: Exporting the extracted data
The extracted data can be exported to other file formats, e.g., CSV, MATLAB, JSON, MS Excel.