WebPlotDigitizer Alternative For Data Extraction

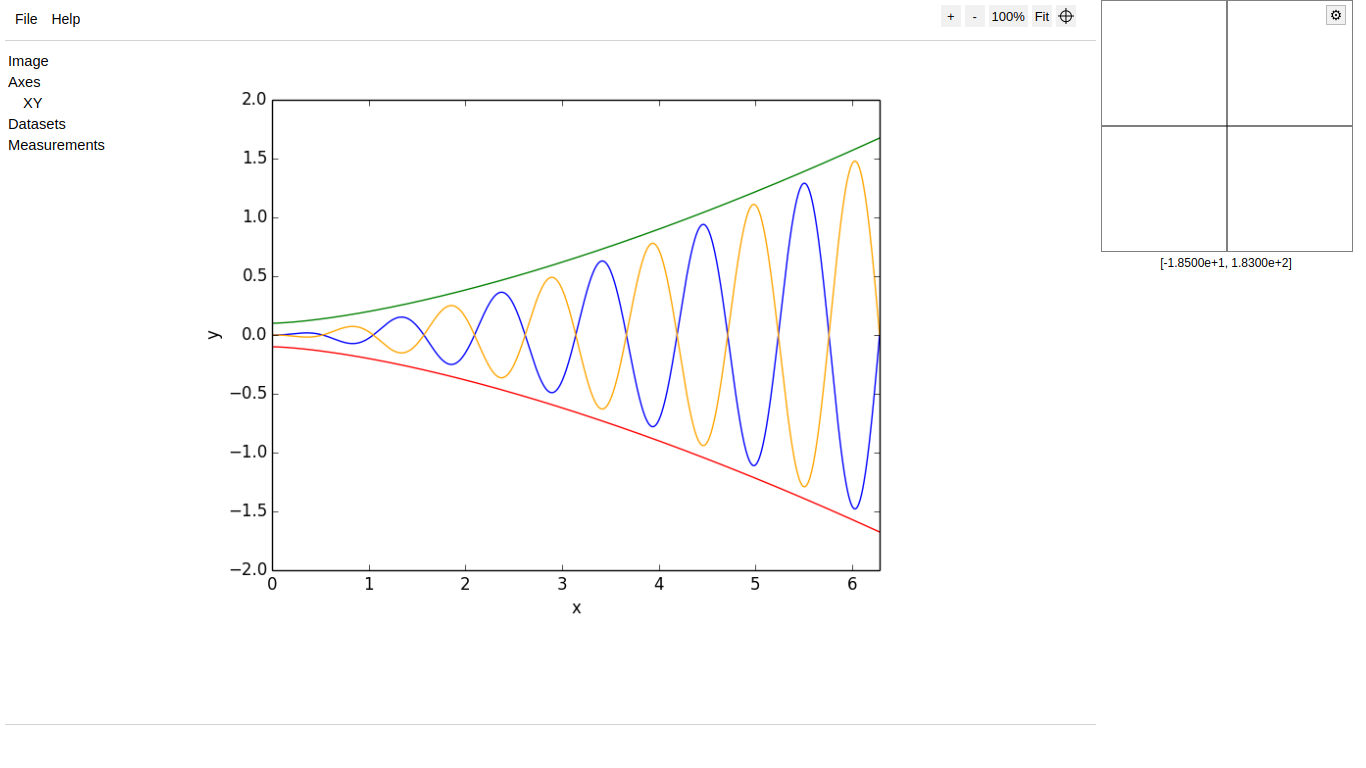
WebPlotDigitizer is one of the popular tools for digitizing your graphs and charts. It is a free and open-source tool. You can find it on Github. You can extract data from XY, ternary, polar, and maps. However, it has many faults and drawbacks. The software is not well-maintained, and it is very buggy and cannot handle heavy operations. If you use it often, you will notice many errors. There are also some major glitches with the user-interface.
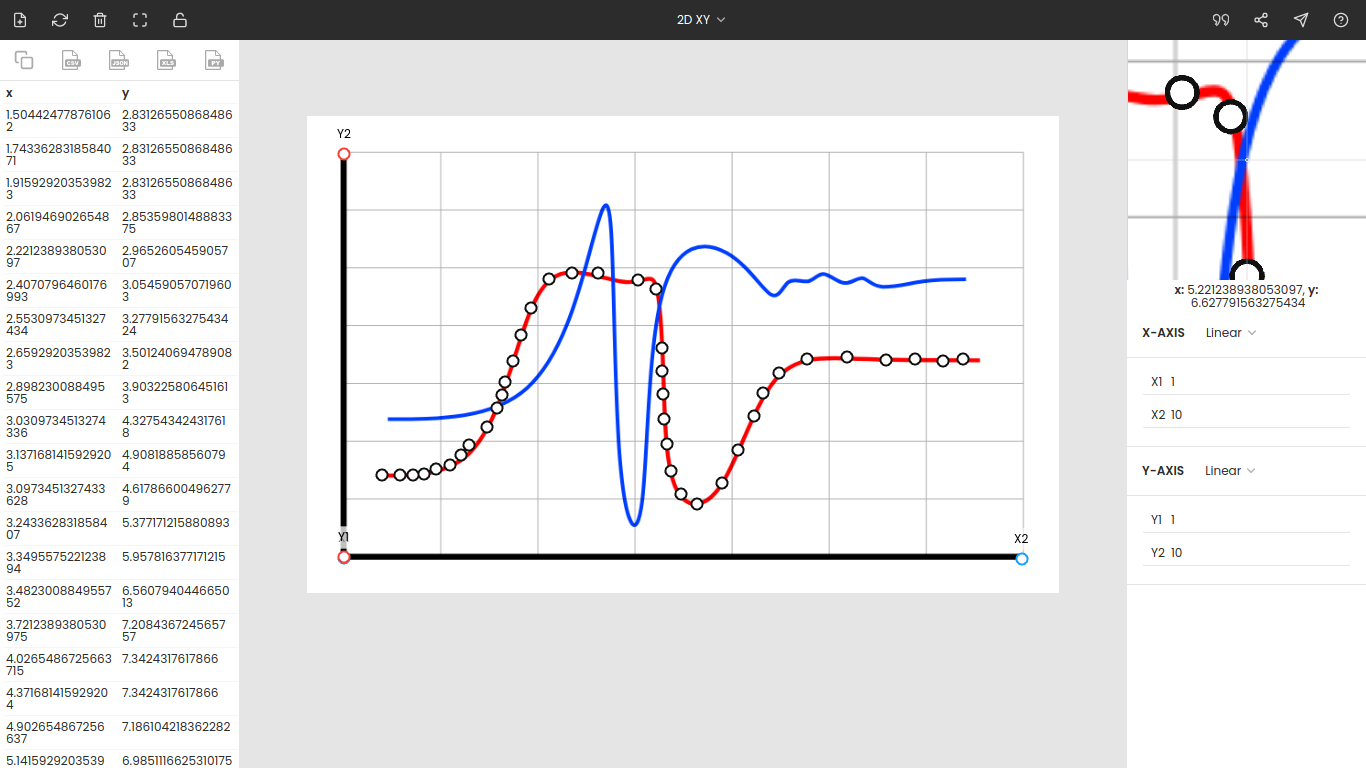
Though the program is free, it comes with many bugs. PlotDigitizer is the best alternative to WebPlotDigitizer; it totally outclasses WebPlotDigitizer. PlotDigitizer has far more features; it is polished and well-maintained and has a professional touch. You can try PlotDigitizer’s free online app. In this short guide, we will compare the features of both.
Online app
Both programs offer free online apps. WebPlotDigitizer is a free, built-in HTML canvas, so you will often see it lagging behind. You might also encounter some bugs and glitches that will continue to persist unless you reload the software gain.
PlotDigitizer also provides a free online app. It can handle heavy operations. Further, the app is simple yet professional and has far fewer bugs. You can check out the free online app here. However, the free version of PlotDigitizer does not give all the functionalities, but it is sufficient for data extraction. For full access, you have to upgrade to the pro.
User interface & user experience
User interface and user experience is a major difference between the two. WebPlotdigitizer has a dull, outdated graphic user interface, whereas PlotDigitizer is polished and professionally designed. From the perspective of users, PlotDigitizer is easy-to-understand for beginners.
Graph types
Both programs support multiple types of graphs, but PlotDigitizer supports more graphs than WebPlotDigitizer. With PlotDigitizer, you can extract numerical data from XY, polar, ternary, bar, column, pie/doughnut, and maps. Moreover, you can calculate the distance, angle, and areas of the portion on an image.
Image editing
Many times, graph and plot images are not perfect; you may need some minor adjustments, like increasing the clarity of the image, rotating the image, or cropping out undesired parts. PlotDigitizer has many image editing features that reduce your reliance on external software.
Export options
WebPlotDigitizer offers only CSV export. On the other hand, PlotDigitizer allows users to export the extracted data to several formats: CSV, JSON, MS Excel, MATLAB, Python list, etc.
Multiple axis scales
The graphs are not only plotted on a linear scale but also on a nonlinear scale, such as logarithmic, date, angular, inverse. Both programs accept nonlinear scales.
Zoom panel
Both software has zoom panels to magnify the portion of the image around the cursor. However, in WebPlotDigitizer, the quality of the image is blurred in the zoom panel, while PlotDigitzer’s zoom panel preserves the image quality.
Platforms
Both are available for Windows, Linux, and Mac.
Image file formats
Both support all common image file formats, that includes, PNG, SVG, JPG, GIF, JPEG.
Automatic data extraction
You can automatically extract data from both programs.
Multiple datasets
You can store and sort the extracted data in multiple datasets in both tools.
| Features | WebPlotDigitizer | PlotDigitizer.com |
|---|---|---|
| Online version | Free web interface | Free online version |
| Platforms | Windows, Mac, Linux | Windows, Mac, Linux |
| Graph types | XY, bar/column (vertical), bar (horizontal), ternary, polar, maps, distance, angle, area | XY, bar (vertical)/column, bar (horizontal), pie/doughnut, ternary, polar, maps, distance, angle, area |
| UI/UX | Traditional and buggy | Modern and professional |
| Image file format | Accepts regular image formats | Accepts several image file formats, including standard ones |
| Image editing | Yes (Zoom, crops, rotate) | Yes (zoom, crop, scale, flip, rotate, clarity) |
| Multiple axis scales | Yes (linear, log, date & time) | Yes (linear, log, reciprocal, date, time axes) |
| Zoom panel | Yes | Yes (better) |
| Export formats | CSV | CSV, JSON, Array, MS Excel, MATLAB |
| Automatic extraction | Yes | Yes |
| Multiple datasets | Available | Available |
Screenshots